Connecting Financial Data Sources in Power BI: Hướng Dẫn Thực Chiến cho Financial DA
Connecting financial data sources in Power BI là kỹ năng nền tảng mà bất kỳ Data Analyst nào làm việc trong lĩnh vực tài chính đều cần thành thạo. Trong thực tế, vấn đề không nằm ở việc tạo ra một dashboard đẹp — vấn đề là dữ liệu đang phân tán ở nhiều nguồn với các format và tần suất cập nhật khác nhau.
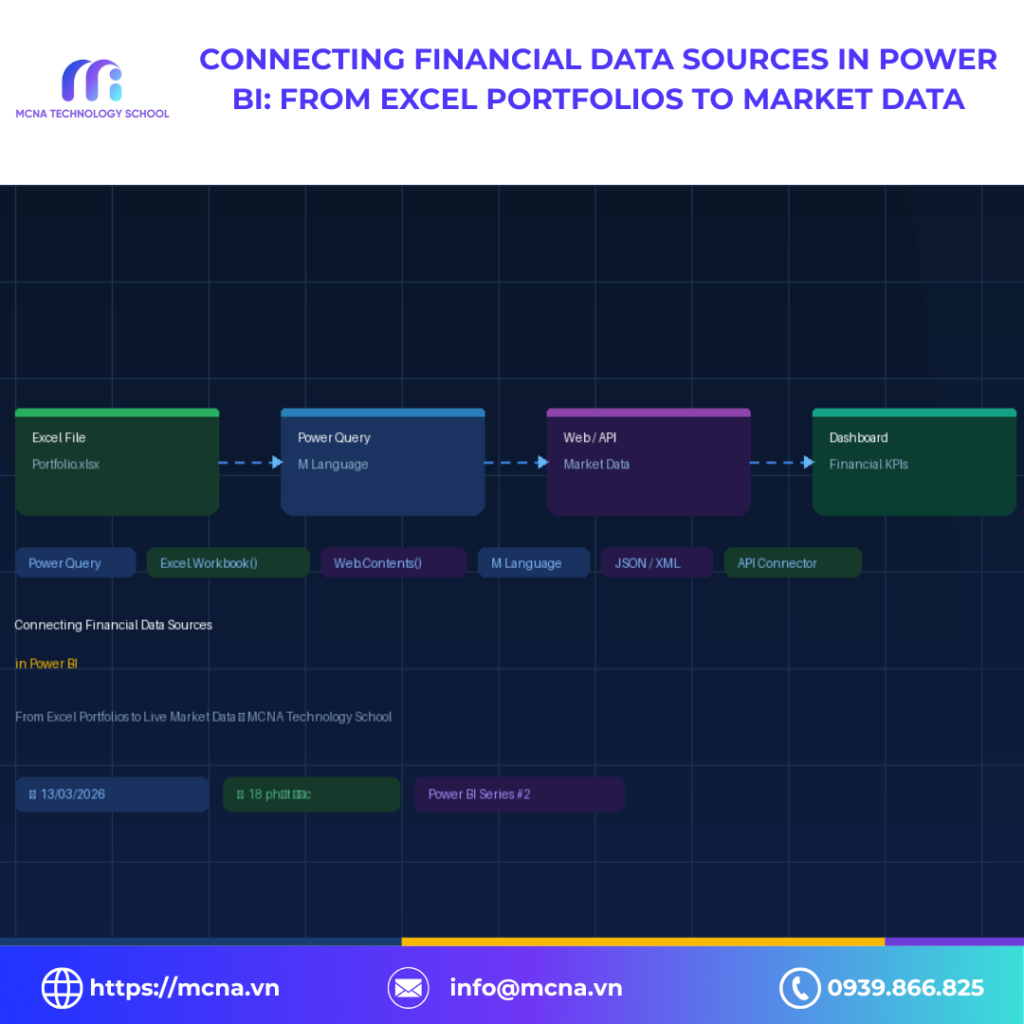
Bài viết này sẽ hướng dẫn toàn bộ quy trình: từ kết nối Excel portfolio, Market Data API, đến Bloomberg Feed — tất cả được hợp nhất vào một pipeline tự động trong Power BI.
Mục Lục
- Tại sao Data Connection quan trọng hơn Dashboard?
- Kiến trúc Data Pipeline cho Financial Data
- Kết nối Excel Portfolio vào Power BI
- Kết nối Market Data qua Web API
- M Language — Ngôn ngữ của Power Query
- Xử lý JSON và XML từ Market Data Feed
- Tự động Refresh và Scheduled Pipeline
- Error Handling trong Data Pipeline
- Kết luận
1. Tại Sao Data Connection Quan Trọng Hơn Dashboard?
Một sai lầm phổ biến trong cộng đồng DA là phân bổ 80% thời gian cho việc tạo dashboard và chỉ 20% cho data pipeline. Hậu quả là dashboard trông chuyên nghiệp nhưng số liệu sai hoặc lỗi thời — điều đặc biệt nghiêm trọng trong môi trường Wealth Management, nơi độ chính xác của dữ liệu ảnh hưởng trực tiếp đến quyết định đầu tư.
Trong một Wealth Management team điển hình, dữ liệu thường đến từ các nguồn sau:
| Nguồn dữ liệu | Format | Tần suất cập nhật | Thách thức chính |
|---|---|---|---|
| Excel Portfolio | XLSX | Hàng ngày | Sheet đổi tên, cột dịch chuyển |
| Market Price API | JSON | Real-time / 15 min | Rate limit, authentication |
| Bloomberg Feed | CSV / XML | End of day | Schema thay đổi theo quý |
| Core Banking | SQL / ODBC | Real-time | Permission, firewall |
| Manual Report | PDF / Email | Hàng tuần | Không tự động hóa được |
💡 Nguyên tắc: Một pipeline tốt phải hoạt động mà không cần DA ngồi canh. Nếu bạn phải thao tác thủ công mỗi sáng thì đó không phải pipeline — đó là công việc lặp đi lặp lại.
2. Kiến Trúc Data Pipeline cho Financial Data
Trước khi viết một dòng M Language, cần thiết kế kiến trúc tổng thể. Một financial data pipeline chuẩn production gồm 4 tầng rõ ràng.
Mô hình 4 tầng: Ingest – Transform – Model – Serve
- Ingest: Thu thập dữ liệu từ Excel, API, CSV, SQL Server
- Transform: Làm sạch và chuẩn hóa dữ liệu bằng Power Query / M Language
- Model: Xây dựng Star Schema và tính toán business logic bằng DAX
- Serve: Xuất ra Dashboard, Report hoặc Automated Email
⚠️ Lỗi kiến trúc phổ biến: Nhiều DA tính toán KPI trong Power Query thay vì DAX. Điều này khiến model chậm và khó maintain. Nguyên tắc rõ ràng: làm sạch data trong Power Query — tính business logic trong DAX.
Các công thức Financial KPI cốt lõi trong Power BI
Sau khi connecting financial data sources in Power BI, đây là các công thức DAX thường dùng nhất:
Portfolio Weight (Trọng số tài sản):
-- DAX
Weight = [MarketValue] / CALCULATE([TotalAUM])
-- Công thức: wi = Vi / Σ Vj
Portfolio Return (Lợi suất danh mục):
-- DAX
PortfolioReturn = SUMX(Assets, [Weight] * [AssetReturn])
-- Công thức: Rp = Σ (wi × Ri)
Holding Period Return (HPR):
-- DAX
HPR = DIVIDE([CurrentPrice] - [CostPrice] + [Dividend], [CostPrice])
LogReturn = LN(DIVIDE([CurrentPrice], [CostPrice]))
Data Freshness Score:
-- DAX
DataFreshness = 1 - DATEDIFF([LastRefresh], NOW(), MINUTE) / 60
-- DFS = 1: data hoàn toàn mới | DFS = 0: đã hết hạn
3. Kết Nối Excel Portfolio vào Power BI
Excel là nguồn dữ liệu phổ biến nhất trong Wealth Management. Khi connecting financial data sources in Power BI, đây thường là bước đầu tiên — nhưng Excel không phải database và cấu trúc file thay đổi liên tục.
Trường hợp 1: File Excel có cấu trúc ổn định
// Kết nối Excel file từ đường dẫn cố định
let
    Source = Excel.Workbook(
        File.Contents("C:\Data\Portfolio_2026.xlsx"),
        null, true
    ),
    Portfolio_Sheet = Source{[Item="Portfolio", Kind="Sheet"]}[Data],
    PromotedHeaders = Table.PromoteHeaders(Portfolio_Sheet,
        [PromoteAllScalars=true]),
    TypedTable = Table.TransformColumnTypes(PromotedHeaders, {
        {"ClientID",  type text},
        {"AssetCode", type text},
        {"Quantity",  Int64.Type},
        {"CostPrice", type number},
        {"TradeDate", type date}
    })
in
    TypedTable
Trường hợp 2: File Excel thay đổi tên theo ngày
Đây là tình huống thực tế phổ biến — file thường có tên dạng “Portfolio_20260313.xlsx”. Giải pháp là tự động chọn file mới nhất trong thư mục thay vì hardcode tên file:
// Tự động lấy file Excel mới nhất trong thư mục
let
    FolderPath = "C:\Data\Portfolio\",
    AllFiles   = Folder.Files(FolderPath),
    ExcelFiles = Table.SelectRows(AllFiles,
        each Text.EndsWith([Name], ".xlsx")),
    LatestFile = Table.Sort(ExcelFiles,
        {{"Date modified", Order.Descending}}){0},
    FileContent = Excel.Workbook(LatestFile[Content], null, true),
    Sheet       = FileContent{[Item="Portfolio", Kind="Sheet"]}[Data],
    Result      = Table.PromoteHeaders(Sheet, [PromoteAllScalars=true])
in
    Result
Trường hợp 3: Combine nhiều Excel files từ nhiều RM
Khi mỗi Relationship Manager gửi file riêng cho từng client, cần combine tất cả lại trong một query:
// Combine tất cả Excel files trong một folder
let
    Source      = Folder.Files("C:\Data\ClientFiles\"),
    Filtered    = Table.SelectRows(Source,
        each Text.EndsWith([Name], ".xlsx")),
    AddData     = Table.AddColumn(Filtered, "Data",
        each Excel.Workbook([Content], true)),
    Expanded    = Table.ExpandTableColumn(AddData, "Data",
        {"Name", "Data"}, {"SheetName", "SheetData"}),
    PortfolioSheets = Table.SelectRows(Expanded,
        each [SheetName] = "Portfolio"),
    AllData     = Table.ExpandTableColumn(PortfolioSheets,
        "SheetData", Table.ColumnNames(
            PortfolioSheets[SheetData]{0})),
    AddFileName = Table.AddColumn(AllData, "SourceFile",
        each [Name])
in
    AddFileName
✅ Best practice: Luôn dùng
Table.TransformColumnTypes()sau khi PromoteHeaders. Power BI auto-detect type thường sai với date format Việt Nam (dd/mm/yyyy vs mm/dd/yyyy).
4. Kết Nối Market Data qua Web API
Đây là phần kỹ thuật phức tạp nhất khi connecting financial data sources in Power BI. Market data API thường có authentication, rate limit và response format nhiều tầng lồng nhau.
Authentication bằng API Key
// Kết nối API với API Key trong Header
let
    ApiKey   = "YOUR_API_KEY_HERE",
    Symbol   = "VNM",
    Endpoint = "https://api.marketdata.example.com/v1/price",
    Url      = Endpoint & "?symbol=" & Symbol & "&period=1y",

    Response = Web.Contents(Url, [
        Headers = [
            #"X-API-Key"  = ApiKey,
            #"Accept"     = "application/json",
            #"User-Agent" = "PowerBI/1.0"
        ],
        Timeout = #duration(0, 0, 0, 30)
    ]),
    JsonData = Json.Document(Response)
in
    JsonData
Xử lý Rate Limiting với Retry Logic
Khi lấy dữ liệu cho nhiều mã chứng khoán, cần có cơ chế xử lý lỗi để một symbol thất bại không làm crash toàn bộ pipeline:
// Hàm lấy giá cho nhiều symbols với error handling
let
    GetPrice = (symbol as text) =>
    let
        Url      = "https://api.example.com/price?symbol=" & symbol,
        Response = try Web.Contents(Url, [
            Headers = [#"X-API-Key" = "YOUR_KEY"]
        ]) otherwise null,
        Result   = if Response = null then
            [symbol=symbol, price=null, error="API_FAILED"]
        else
            Json.Document(Response)
    in
        Result,

    Symbols   = {"VNM", "VCB", "FPT", "HPG", "TCB"},
    PriceList = List.Transform(Symbols, each GetPrice(_)),
    AsTable   = Table.FromList(PriceList,
        Splitter.SplitByNothing(), null, null, ExtraValues.Error),
    Expanded  = Table.ExpandRecordColumn(AsTable, "Column1",
        {"symbol", "price", "change_pct"})
in
    Expanded
💡 Quan trọng: Lưu API Key trong Power BI Parameters, không hardcode trong query. Vào Home → Manage Parameters → New Parameter.
5. M Language — Ngôn Ngữ của Power Query
M Language là ngôn ngữ functional của Power Query. Hiểu M là điều kiện cần để xử lý connecting financial data sources in Power BI ở mức production — những thứ mà GUI không làm được.
Pattern 1: Dynamic Column Selection
Financial data thường có nhiều cột và vị trí cột thay đổi theo thời gian. Luôn chọn cột theo tên, không theo vị trí:
// Chọn cột theo tên, không theo vị trí
let
    RequiredCols = {"ClientID", "AssetCode", "MarketValue",
                    "Weight", "ReturnYTD"},
    Source       = /* your data source */,
    ExistingCols = Table.ColumnNames(Source),
    ValidCols    = List.Intersect({RequiredCols, ExistingCols}),
    Selected     = Table.SelectColumns(Source, ValidCols)
in
    Selected
Pattern 2: Tạo DimDate tự động bằng M Language
// Tạo DimDate tự động
let
    StartDate   = #date(2020, 1, 1),
    EndDate     = Date.From(DateTime.LocalNow()),
    DateList    = List.Dates(StartDate,
        Duration.Days(EndDate - StartDate) + 1,
        #duration(1,0,0,0)),
    DateTable   = Table.FromList(DateList,
        Splitter.SplitByNothing(), {"Date"}),
    AddYear     = Table.AddColumn(DateTable, "Year",
        each Date.Year([Date]), Int64.Type),
    AddMonth    = Table.AddColumn(AddYear, "Month",
        each Date.Month([Date]), Int64.Type),
    AddQ        = Table.AddColumn(AddMonth, "Quarter",
        each "Q" & Text.From(Date.QuarterOfYear([Date]))),
    AddIsMarket = Table.AddColumn(AddQ, "IsMarketDay",
        each Date.DayOfWeek([Date]) < 5, type logical)
in
    AddIsMarket
Pattern 3: Parameterized Query
// Tạo Parameter: Home → Manage Parameters → New Parameter
// Name: StartDate, Type: Date, Default: 2026-01-01

let
    Source   = /* your source */,
    Filtered = Table.SelectRows(Source,
        each [TradeDate] >= StartDate
          and [TradeDate] <= EndDate)
in
    Filtered
6. Xử Lý JSON và XML từ Market Data Feed
Market data API thường trả về JSON với cấu trúc nhiều tầng lồng nhau. Khi connecting financial data sources in Power BI từ loại nguồn này, bước quan trọng là flatten data về dạng table phẳng trước khi đưa vào model.
Xử lý JSON nested
// JSON response ví dụ:
// {
//   "status": "success",
//   "data": {
//     "symbol": "VNM",
//     "prices": [
//       {"date": "2026-03-13", "close": 82500, "volume": 1234567}
//     ]
//   }
// }

let
    Response  = Web.Contents("https://api.example.com/history/VNM"),
    Json      = Json.Document(Response),
    DataNode  = Json[data],
    Symbol    = DataNode[symbol],
    PriceList = DataNode[prices],
    AsTable   = Table.FromList(PriceList,
        Splitter.SplitByNothing()),
    Expanded  = Table.ExpandRecordColumn(AsTable, "Column1",
        {"date", "close", "volume"}),
    AddSymbol  = Table.AddColumn(Expanded, "Symbol",
        each Symbol, type text),
    TypedTable = Table.TransformColumnTypes(Expanded, {
        {"date",   type date},
        {"close",  type number},
        {"volume", Int64.Type}
    })
in
    TypedTable
Combine nhiều API calls cho toàn bộ danh mục
// Lấy historical prices cho nhiều symbols
let
    Symbols = {"VNM", "VCB", "FPT", "HPG", "TCB", "VHM"},

    GetHistory = (sym as text) =>
    let
        Url  = "https://api.example.com/history/" & sym,
        Raw  = try Json.Document(Web.Contents(Url))
               otherwise null,
        Rows = if Raw = null
               then #table({"Symbol","Date","Close"}, {{sym,null,null}})
               else Table.AddColumn(
                   Table.FromList(Raw[data][prices],
                       Splitter.SplitByNothing()),
                   "Symbol", each sym)
    in Rows,

    AllData  = List.Transform(Symbols, GetHistory),
    Combined = Table.Combine(AllData)
in
    Combined
✅ Performance tip: Power BI mặc định chạy parallel khi combine nhiều API calls — có thể trigger lỗi 429 Too Many Requests. Để tắt: Options → Query → Parallel loading → Disable.
7. Tự Động Refresh và Scheduled Pipeline
Một pipeline production cần chạy tự động hoàn toàn. Sau khi hoàn thành connecting financial data sources in Power BI, đây là checklist cấu hình Scheduled Refresh:
- ✓ Publish report lên Power BI Service (Workspace)
- ✓ Cài Power BI Gateway nếu data source là on-premise (Excel local, SQL Server nội bộ)
- ✓ Dataset Settings → Data source credentials → Nhập lại credentials
- ⚠️ Set timezone đúng: Asia/Ho_Chi_Minh
- ⚠️ Giới hạn refresh: 8 lần/ngày (Pro) hoặc 48 lần/ngày (Premium)
- ✗ Không dùng relative path — luôn dùng absolute path hoặc SharePoint URL
SharePoint — Best practice cho team
Thay vì lưu Excel trên local drive, hãy lưu trên SharePoint. Đây là cách đơn giản nhất để tự động refresh mà không cần Gateway:
// Kết nối file Excel từ SharePoint
let
    SPSite  = "https://yourcompany.sharepoint.com/sites/Finance",
    SPFiles = SharePoint.Files(SPSite, [ApiVersion=15]),
    Target  = Table.SelectRows(SPFiles,
        each [Name] = "Portfolio_2026.xlsx"),
    File    = Target{0}[Content],
    WB      = Excel.Workbook(File, null, true),
    Sheet   = WB{[Item="Portfolio", Kind="Sheet"]}[Data]
in
    Table.PromoteHeaders(Sheet)
Lịch Refresh Tối Ưu cho Wealth Management Pipeline
| Giờ | Action | Nguồn |
|---|---|---|
| 06:00 | Refresh Excel portfolio files từ SharePoint | Excel + SharePoint |
| 08:00 | Pull End-of-Day prices từ Bloomberg Feed | Bloomberg |
| 09:00 | Mở cửa: Real-time API bắt đầu (mỗi 15 phút) | Market API |
| 12:00 | Giữa phiên: full refresh + Validation check | All sources |
| 15:30 | Đóng cửa: EOD snapshot cuối ngày | Market API |
| 17:00 | Export automated report → Email RM team | Power BI Service |
8. Error Handling trong Data Pipeline
Trong quá trình connecting financial data sources in Power BI, lỗi pipeline là điều không thể tránh khỏi. Vấn đề không phải là tránh lỗi — mà là xây dựng pipeline đủ robust để xử lý lỗi một cách graceful và có thể audit lại sau.
Validation Layer — phát hiện sớm data quality issues
// Validation step trong Power Query
let
    Source        = /* your source */,
    RowCount      = Table.RowCount(Source),
    NullClientIDs = Table.RowCount(
        Table.SelectRows(Source,
            each [ClientID] = null or [ClientID] = "")),
    NullPrices    = Table.RowCount(
        Table.SelectRows(Source,
            each [MarketValue] = null or [MarketValue] < 0)),

    ValidationLog = #table(
        {"Check", "Result", "Count", "Status"},
        {
            {"Row Count",
             RowCount > 0, RowCount,
             if RowCount > 0 then "PASS" else "FAIL"},
            {"Null ClientID",
             NullClientIDs = 0, NullClientIDs,
             if NullClientIDs = 0 then "PASS" else "WARN"},
            {"Invalid Price",
             NullPrices = 0, NullPrices,
             if NullPrices = 0 then "PASS" else "WARN"}
        })
in
    ValidationLog
⚠️ Production tip: Tạo một query riêng tên “DataQualityLog” để track validation results theo ngày. Khi có sự cố, bạn biết ngay data bị lỗi từ bước nào và từ nguồn nào.
Bảng lỗi thường gặp và cách xử lý
| Lỗi | Nguyên nhân | Cách xử lý |
|---|---|---|
| DataSource.Error | File đổi tên hoặc đã bị xóa | Dùng Folder.Files() lấy file mới nhất |
| Expression.Error | Cột bị đổi tên | Dùng Table.SelectColumns + List.Intersect |
| Web.Error 429 | Rate limit API | Tắt Parallel Loading, thêm try/otherwise |
| Timeout Error | API chậm hoặc mất kết nối | Thêm Timeout parameter trong Web.Contents |
| Type Mismatch | Date format khác nhau giữa nguồn | Dùng Date.FromText() với format explicit |
9. Kết Luận
Connecting financial data sources in Power BI không chỉ là kỹ thuật thuần túy. Đây là kỹ năng hiểu toàn bộ data journey — từ lúc dữ liệu phát sinh ở nguồn đến khi xuất hiện trên dashboard của Portfolio Manager.
Biết Excel.Workbook() là đủ để làm demo. Nhưng biết xử lý file đổi tên, rate limit API, validation layer và scheduled refresh mới đủ để deploy production.
Ba nguyên tắc vàng khi xây dựng Financial Data Pipeline
- Luôn dùng
Folder.Files()thay vì hardcode path — pipeline tự động chọn file mới nhất mà không cần can thiệp thủ công. - Luôn có
try/otherwisekhi gọi API — một symbol lỗi không nên làm crash toàn bộ pipeline. - Luôn thêm Validation Layer — phát hiện data quality issues trước khi chúng ảnh hưởng đến báo cáo gửi client.
Bài tiếp theo trong series Power BI Financial Analytics: Advanced DAX cho Financial Reporting — Time Intelligence, Running Total và Portfolio Attribution.
Tham khảo thêm: Microsoft Power Query M Reference — tài liệu chính thức đầy đủ các hàm M Language.
Về tác giả
Triều Đặng — Middle Data Analyst tại MCNA Technology School. Chuyên về financial data analytics, Power BI và automated reporting trong môi trường Wealth Management.
MCNA Technology School là đơn vị tiên phong đào tạo AI, Big Data, Business Intelligence, Power BI, Python, SQL tại Việt Nam — đối tác đào tạo của 300+ doanh nghiệp bao gồm Viettel Global, Masan Group, Techcombank, VPBank, Daikin.
- 🌐 mcna.vn
- 📘 facebook.com/mcnatechnologyschool
- ▶️ youtube.com/@mcna.technology.school
- 💼 linkedin.com/company/mcna-vn
- 📞 0939.866.825 (Mr. Minh Khang)
- 📍 30 Trung Liệt, Đống Đa, Hà Nội
- 📍 Liền kề 44B, TT2, Văn Quán, Hà Đông, Hà Nội
- 📍 The BIB Space, 50B Phan Tây Hồ, Cầu Kiệu, TPHCM